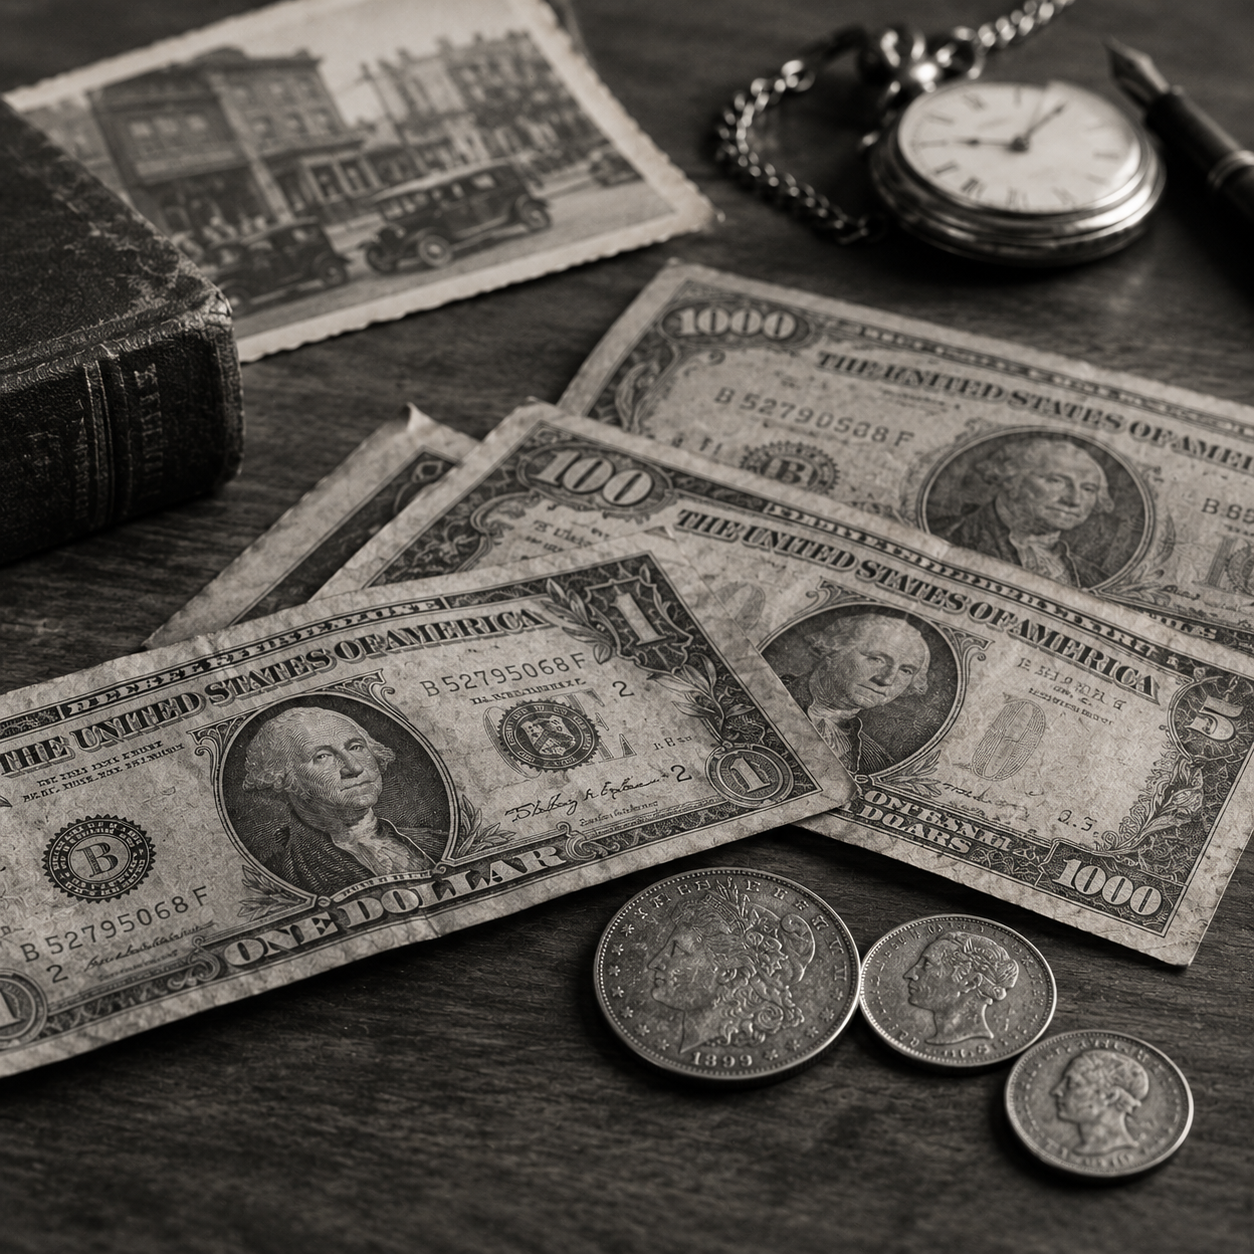
In 1950, a single dollar bought roughly seven or eight loaves of bread, a gallon of milk with change to spare, or about 33 first-class stamps. Today a dollar barely covers one stamp. That gap is inflation at work, and it is the reason the answer to “$1 in 1950 worth today” surprises most people.
Inflation is the steady rise in prices that makes each dollar buy a little less every year. A 3% rise looks harmless in a single year, but over 76 years it compounds dramatically. Using official Bureau of Labor Statistics (BLS) data, the figure for $1 in 1950 worth today is about $13.98, which means consumer prices are roughly 14 times higher than they were then.
One conversion number cannot show how life actually felt. Eggs, clothing and cars became relatively cheaper, while healthcare, postage and bread climbed much faster than average. This guide covers the exact CPI math, 10 everyday price comparisons, and how many minutes of work common items cost then and now. You will also be able to convert any 1950 amount yourself.

Key takeaways
- $1 in 1950 worth today ≈ $13.98 (CPI-U, 1950 annual average vs. September 2026).
- $100 in 1950 ≈ $1,398.09 today.
- Prices did not rise evenly: clothing rose about 3.4 times, eggs about 4.5 times, medical care about 39 times.
- The 1950 federal minimum wage of $0.75 an hour equals about $10.49 today, which is more than the current federal minimum of $7.25.
- The average family income in 1950 was $3,300, or roughly $46,100 in today’s dollars ($3,300 × 13.98).
How Much Is $1 in 1950 Worth Today?
The standard tool is the U.S. Consumer Price Index for All Urban Consumers (CPI-U). The 1950 annual average was 24.1. The latest reading, for September 2026, was 336.940 (1982–84 = 100), published in the BLS release of October 14, 2026. Divide one by the other and you get a multiplier of 13.98.
| Amount in 1950 | Worth in September 2026 |
|---|---|
| $1 | $13.98 |
| $5 | $69.90 |
| $10 | $139.81 |
| $50 | $699.05 |
| $100 | $1,398.09 |
| $500 | $6,990.46 |
| $1,000 | $13,980.91 |
Consumer prices have risen about 1,298% since 1950, or roughly 3.5% a year compounded over 76 years. Inflation is still moving: the CPI-U rose 3.7% in the 12 months to September 2026, and the October figures are due on November 10, 2026. Each release nudges the $1 in 1950 worth today figure slightly.
How We Calculate $1 in 1950 Worth Today
The Consumer Price Index Explained
The CPI tracks the average change in prices urban consumers pay for a fixed basket of goods and services, including food, housing, transportation, medical care and clothing. BLS collects prices every month and compares them with a 1982–84 base of 100. Because the basket stays comparable over time, the CPI is the best single tool for measuring how much a dollar’s purchasing power has changed.
The Formula for $1 in 1950 Worth Today
Value today = Amount in 1950 × (Today’s CPI ÷ 1950 CPI)
Worked example: to go beyond $1 in 1950 worth today and convert $37 from 1950, multiply $37 by (336.940 ÷ 24.1). That gives $37 × 13.98 = $517.29.
Why Calculators Give Slightly Different Answers
If you compare several calculators for $1 in 1950 worth today, expect small differences. There are four common reasons:
- The 1950 base. The CPI-U climbed through 1950, from 23.5 in January to 25.0 in December. January gives $14.34 for $1, December gives $13.48, and the annual average gives $13.98.
- The comparison month. A calculator that stops at an earlier 2026 month returns a slightly lower number.
- The index. CPI-U and CPI-W (urban wage earners) differ a little. The 1950 annual average for CPI-W was 24.2.
- Revisions and rounding. Historical series are occasionally rebuilt or rounded differently.
Quote $1 in 1950 worth today as “about $14” and state the comparison month.
10 Price Comparisons: What Could $1 Buy in 1950?
These examples put $1 in 1950 worth today in context. Each comparison pairs a typical 1950 price with the official BLS category change since then. Grocery and gasoline prices for 1950 are widely cited averages that vary by city and source, so treat them as typical rather than exact. The category multipliers come from BLS indexes, 1950 annual average to September 2026, and the overall benchmark is 13.98 times.
1. Bread and Everyday Groceries
A loaf of bread cost roughly 12 to 14 cents, so $1 bought seven or eight loaves. Groceries overall have risen about 11.8 times, below the 14-times average. Bread is the exception: its index is up about 19.1 times, among the steeper food increases.
2. Milk and Dairy
A gallon of milk is most often cited at about 83 cents, so $1 bought a gallon with a little left over. Milk is up only about 8.1 times, well under the overall average. More efficient dairy farming and distribution, and the shift from home delivery to supermarkets, are common explanations.
3. Eggs
Eggs sold for about 60 cents a dozen, so $1 bought around 20. At the 1950 minimum wage, a dozen took about 48 minutes of work. The egg index has risen only about 4.5 times, less than a third of overall inflation, although short-term spikes (such as hen disease outbreaks) can make eggs feel expensive in any given month.
4. Gasoline
Gasoline averaged about 27 cents a gallon in 1950, so $1 bought roughly 3.7 gallons. The AAA national average was $4.27 on October 22, 2026, so a dollar now buys about 0.23 gallons. That is roughly a 16-times rise in the pump price, and the CPI gasoline index shows about 18 times, both faster than the overall 14 times. New cars tell a different story, with an index up only about 4.3 times, but modern cars have safety and emissions equipment that 1950 models lacked, so that is not a like-for-like comparison.
5. Movie Tickets
Movies were the dominant mass entertainment of the day. Average tickets are reported at 40 to 46 cents depending on the source, so $1 bought two. Cinemark reports an average U.S. ticket of $16.08 in 2025, roughly 35 to 40 times the 1950 price. Streaming and home video have changed how households spend on entertainment, so a ticket-to-ticket comparison overstates the change in what a typical family pays.
6. Public Transportation
Fares varied widely by city, and we could not confirm a reliable national average for 1950, so we do not quote one. The trend is verifiable: the public transportation index is up about 21.7 times, roughly 55% faster than overall inflation.
7. Postage
A first-class stamp cost 3 cents, so $1 mailed 33 letters. The Forever stamp now costs 82 cents (up from 78 cents on July 12, 2026), so a dollar buys one stamp with 18 cents left. Postage is up about 27.3 times, nearly double the overall rate. A stamp took about 2 minutes of minimum-wage work in 1950 and takes about 7 at today’s $7.25.
8. Clothing and Shoes
Clothing is the biggest inflation success story in the data. Apparel is up only about 3.4 times and footwear about 4.9 times. Offshore manufacturing, synthetic fibers and automation are the usual explanations. Styles and quality have changed too much for a direct garment-to-garment comparison, but the index shows clothing becoming far cheaper relative to most other things.
9. Healthcare
Healthcare is the opposite case. Medical care is up about 39.2 times and doctor visits about 27.9 times, roughly three times and two times the overall rate, respectively. Services are harder to automate than manufactured goods, which is a commonly cited reason. Care today also includes treatments that did not exist in 1950, so the index understates how different the product is.
10. Rent and Housing
The 1950 Housing Census reported a median contract rent of $35 and a median gross rent of $42 (rent plus utilities) for nonfarm homes. Against average family income of $3,300 a year, or $275 a month, gross rent took roughly 15% of income. The CPI rent index is up about 15 times, which would put a like-for-like $42 rent near $630 today. Actual rents are higher because homes are larger, better equipped and often in costlier places, so the index measures price change for the same housing, not what renting costs now.
Tip: do not multiply a 1950 price by 13.98
The multiplier is an average across thousands of items. Cars, clothes and eggs rose far less than that, while postage and medical care rose far more. To estimate a single item, use its own category index instead.
What Did $1, $10 and $100 Mean in 1950?
The federal minimum wage had just risen to $0.75 an hour in 1950, and average family income was about $3,300, or $275 a month. In minutes and hours of minimum-wage work:
| Amount | Minimum-wage work | Share of family income |
|---|---|---|
| $1 | about 80 minutes | 0.4% of a month |
| $10 | about 13 hours | 3.6% of a month |
| $100 | about 133 hours | 3% of a year |
A dollar was small but not trivial. For scale, $100 equaled roughly two and a half months of median gross rent ($42 a month).
Work Time for Common Items in 1950
| Item | Typical 1950 price | Work time at $0.75/hr |
|---|---|---|
| Loaf of bread | about 13¢ | about 10 min |
| Dozen eggs | about 60¢ | about 48 min |
| Gallon of milk | about 83¢ | about 66 min |
| Gallon of gasoline | 27¢ | about 22 min |
| Movie ticket | 40–46¢ | about 32–37 min |
| First-class stamp | 3¢ | about 2 min |
The Same Items at Today’s Federal Minimum Wage
| Item | 1950 work time ($0.75/hr) | Today’s price | Work time ($7.25/hr) |
|---|---|---|---|
| Gallon of gasoline | about 22 min | $4.27 | about 35 min |
| First-class stamp | about 2 min | 82¢ | about 7 min |
| Movie ticket | about 32–37 min | $16.08 (2025 avg.) | about 133 min |
What this shows
The federal minimum wage of $7.25 is significantly lower in real terms than the $0.75 minimum wage of 1950, which equals roughly $10.49 today. As a result, it now takes longer at the federal minimum wage to earn the price of gas, stamps and movie tickets than it did back then. However, many states and employers pay more than the federal minimum. As today, earnings in 1950 varied by occupation, region, race and gender. Use these tables as a rough benchmark, not as a judgment of any particular household.
Raw price comparisons also miss part of the picture. Families today spend on goods and services that did not exist in 1950, such as smartphones, home internet and many modern medical treatments.
1950 Prices vs. Today’s Prices: What Changed Most?
The table ranks how much prices in each category have multiplied since 1950, against the overall 13.98 times. Figures come from BLS category indexes, 1950 annual average to September 2026.
| Category | Prices multiplied by | $100 in 1950 equals |
|---|---|---|
| Clothing | 3.4× | $338.68 |
| New cars | 4.3× | $426.40 |
| Eggs | 4.5× | $448.86 |
| Shoes | 4.9× | $493.43 |
| Milk | 8.1× | $807.98 |
| Electricity | 11.2× | $1,123.48 |
| Groceries | 11.8× | $1,175.75 |
| All items (overall CPI) | 14.0× | $1,398.09 |
| Rent | 15.0× | $1,498.16 |
| Gasoline | 18.0× | $1,797.61 |
| Bread | 19.1× | $1,908.65 |
| Public transportation | 21.7× | $2,169.57 |
| Postage | 27.3× | $2,728.21 |
| Doctor visits | 27.9× | $2,793.87 |
| Medical care (overall) | 39.2× | $3,919.98 |
Goods tend to rise more slowly than average. Clothing, shoes, new cars and eggs rose far less than 14 times, helped by automation, global supply chains and competition. Services tend to rise faster. Medical care, doctor visits, postage and transit all rose far more than the average. We did not compare education or childcare because we could not verify a consistent 1950 dataset for them.
Long-run comparisons are also approximate because products change. A 1950 refrigerator, car or doctor’s visit is not the same product as today’s. Price indexes try to adjust for quality, but no adjustment is perfect.
How to Calculate the Value of Any Amount From 1950
- Choose the amount from 1950 (for example, $250).
- Find the 1950 CPI. The annual average CPI-U is 24.1. If you know the month, use that month instead.
- Find the latest CPI. At the time of writing it is 336.940 (September 2026).
- Divide the latest CPI by the 1950 CPI: 336.940 ÷ 24.1 = 13.98, the multiplier behind $1 in 1950 worth today.
- Multiply by your amount: $250 × 13.98 = $3,495.23.
Spreadsheet shortcut: put your amount in cell A2 and enter =A2*(336.94/24.1). Or skip the math with any online inflation calculator. Curious about another era? See what 1899 dollars are worth today.
Common mistakes to avoid:
- Comparing a 1950 price with today’s price for a different quality of product.
- Mixing CPI bases, such as a 1982–84 index for one year and a different base for another.
- Considering a CPI-adjusted amount to be the current price. It displays the amount that would have been obtained if the item had increased at the average rate.
- Leaving out the comparison month. $1 in 1950 worth today shifts slightly with every CPI release.
Frequently Asked Questions
How much is $1 in 1950 worth today?
$1 in 1950 worth today is about $13.98, based on the 1950 annual average CPI-U of 24.1 and the September 2026 CPI-U of 336.940. In round terms, $1 in 1950 worth today is about $14.
How much are $10, $100 and $1,000 from 1950 worth today?
Using the same method as $1 in 1950 worth today, $10 is about $139.81, $100 is about $1,398.09, and $1,000 is about $13,980.91. Multiply the $1 in 1950 worth today figure of $13.98 by any amount to scale it.
What could $1 buy in 1950?
Typical examples are seven or eight loaves of bread, a gallon of milk with a little change, roughly 20 eggs, about 3.7 gallons of gasoline, around 33 first-class stamps, or two movie tickets. Prices varied by place and source, so treat these as typical rather than exact when you compare them with $1 in 1950 worth today.
Were things cheaper in 1950?
The dollar prices were lower, but $1 in 1950 worth today is about $13.98, so affordability depends on income. At the $0.75 minimum wage, a dozen eggs took about 48 minutes of work. Clothing and cars are much cheaper relative to prices overall today, while healthcare is far more expensive, which is why $1 in 1950 worth today is an average rather than a verdict on every item.
Did Americans earn less in 1950?
In dollar terms, yes: average family income was $3,300 a year, or about $46,100 in today’s dollars. Earnings varied widely by occupation, location and employment status, so keep that in mind when you read $1 in 1950 worth today: a national average does not describe every worker or family.
Is an inflation calculator completely accurate?
No. A figure for $1 in 1950 worth today gives a reasonable estimate of general purchasing power but not the price of any individual item, and results change slightly with the CPI series, base year and comparison month, so $1 in 1950 worth today can read anywhere from $13.48 to $14.34.
Final Thoughts
The dollar’s purchasing power has changed dramatically: $1 in 1950 worth today is about $13.98. Gas, stamps, bread and movie tickets make that number easier to feel. The most useful way to read any inflation-adjusted figure is alongside wages, working hours and quality, because that shows whether something was truly cheap or expensive for the people who lived then.
Want to try more than $1 in 1950 worth today? Use the formula above to compare any year to today.
Sources and Methodology
- U.S. Bureau of Labor Statistics, Consumer Price Index news release, September 2026 (CPI-U 336.940, 3.7% over 12 months, released October 14, 2026).
- 1950 annual average CPI-U (24.1) and monthly values: BLS data as compiled in the historical CPI table at usinflationcalculator.com.
- Category price changes since 1950 and the 1950 federal minimum wage: Official Data Foundation, Prices in 1950 vs. Today, based on BLS and U.S. Department of Labor data.
- U.S. Census Bureau, Income of Families and Persons in the United States: 1950 (average family income $3,300).
- Housing and Home Finance Agency, The Housing Situation – 1950 (median nonfarm contract rent $35; median gross rent $42).
- AAA national gas price average ($4.2701 on October 22, 2026).
- Cinemark movie ticket prices guide (average U.S. ticket $16.08 in 2025).
- 1950 grocery, gasoline and movie prices are widely cited averages that differ by source, so they appear as approximate figures or ranges. Only the CPI figures and category multipliers are official.
About the Author
Rio is the creator of EMIChecker and writes educational content on EMI calculations, loans, investment concepts, and personal finance tools. Through practical guides and calculators, Rio aims to help readers better understand financial topics and make more informed decisions.
Financial Disclaimer
The information and calculators provided on this website are for educational and informational purposes only and should not be considered financial, investment, tax, or legal advice.
Calculator results are estimates based on the information provided and may vary due to individual circumstances and market conditions.
Always consult a qualified financial professional before making any financial decisions.